Definitions/comments
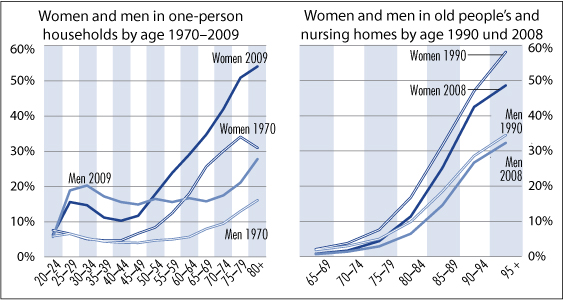
Left graphe: Proportion of the population living in a one-person household.
Right graph: 1990: old people’s and nursing homes, prisons and monasteries. 2008: people living in institutions providing social or medical care (EMS).
Sample size: SLFS 2009: 49,390; weighted data.
Source: left graph: SFSO: Census 1970, SLFS 2009; right graph: SFSO: Census 1990, Statistics on institutions providing social or medical care 2008.
Print this pageDownload datain Excel format

 One-person households, old people’s and nursing homes 1970-2009
  Size of households 2008
  Social isolation by country and education 2008