Political configuration
Electorate of the parties
![]()
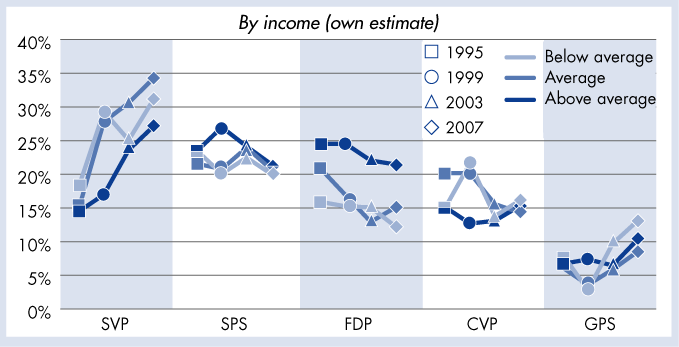
Electorate of the parties 1995–2007, by income (own estimate)
Definitions/Comments: Income: ‘How would you rate your household’s income relative to the Swiss average?’ (answer categories: ‘below average’, ‘about average’, ‘above average’). Parties: see list of abbreviations.
Question wording: ‘Which party has received most of your votes (at the last election for the National Council)?
Sample size: Selects 1900 (1995), 2000 (1999), 5891 (2003), 4410 (2007). Data are – apart from usual weights – weighted according to the official electoral outcome, because the electorate of the SPS especially is overrepresented in the survey.
Source: Selects 1995, 1999, 2003, 2007.
Data for the indicator or in excel.
Description and explanation in the corresponding chapter of the Social Report 2008.

