Cultural diversity
Use of the media
![]()
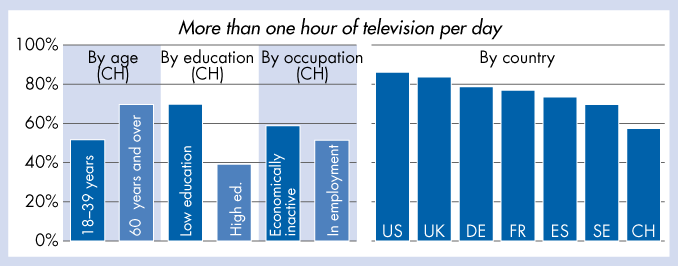
Use of the media 2006 – More than one hour of television per day
Definitions/comments: Educational levels: low: ISCED 0–2 (compulsory schooling, pre-vocational education); intermediate: ISCED 3–4 (apprenticeship, matura); high: ISCED 5–6 (university, other tertiary). Economic activity: Persons who indicated that they are mainly economically active.
Question wording: ‘On an average weekday, how much time, in total, do you spend watching television?‘
Answer categories: ‘no time at all’, ‘less than ½ hour’, ‘½ hour to 1 hour’, ‘more than 1 hour’, up to 1 ½ hours’, ‘more than 1 ½ hours’, ‘up to 2 hours’, ‘more than 2 hours’, ‘up to 2 ½ hours’, ‘more than 2 ½ hours’, ‘up to 3 hours’, ‘more than 3 hours’. Percentages correspond to respondents watching television for over an hour on an average weekday.
Sample size: ESS 2006: 1804–2916; US-CID: 1001; weighted data.
Source: ESS 2006; US-CID 2005.
Data for the indicator or in excel.
Description and explanation in the corresponding chapter of the Social Report 2008.

