Political configuration
Political trust
![]()
Trust in institutions 1995 and 2006: proportion of population with trust
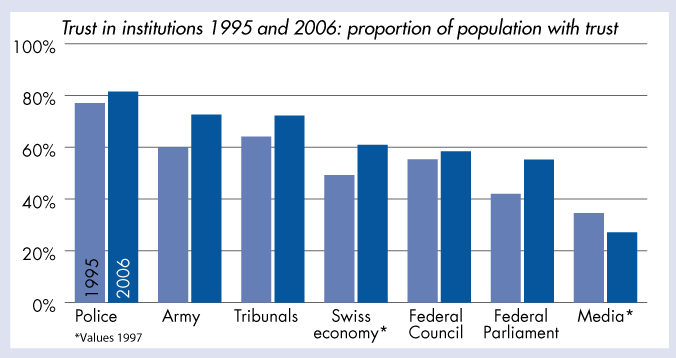
Question wording: ‘I will now read out the names of some the institutions in public life in Switzerland and would like to know whether you trust them or not. Tell me your opinion on a 10-point scale, with 10 meaning that you fully trust this institution and 1 meaning that you have no trust at all in this institution. With the numbers in between you may grade your opinions: in the Federal Council? in the Federal parliament? in tribunals? in the police? in the army? in the media? in the Swiss economy?’
Answer categories: Percentages correspond to the respondents who indicated values between 6 and 10 on a scale from 1 to 10.
Sample size: Security survey 1995: 795; Security survey 1997: 1014 (1997); Security survey 2006: 1200.
Source: Security survey 1995, 1997, 2006 ETH Zurich. Haltiner, Karl W. (1995), Befragung der Schweizer Bevölkerung zu sicherheits- und verteidigunspolitischen Themen - 1995. Au/Wädenswil: ETH Zürich, Militärische Führungsschule – MFS. Haltiner, Karl W.; Kurt R. Spillmann und Luca Bertossa (1997), Meinungsbild zur Sicherheits- und Verteidigungspolitik der Schweiz - 1997. ETH Zürich, Forschungsstelle für Sicherheitspolitik und Konfliktanalyse – SEK; ETH Zürich, Militärische Führungsschule MFS. Haltiner, Karl W.; Andreas Wenger, Tibor Szvircsev Tresch und Silvia Würmli: Meinungsbild zur Sicherheits- und Verteidigungspolitik der Schweiz - 2006. Birmensdorf, Zürich: Militärakademie an der ETH Zürich; ETH Zürich, Forschungsstelle für Sicherheitspolitik.
Data for the indicator or in excel.
Description and explanation in the corresponding chapter of the Social Report 2008.